
Top 7 RCM KPIs Every Practice Should Track — Days in AR, Denial Rate & More

Want better cash flow and less revenue leakage? Measure the right things. This guide breaks down the 7 must-track revenue cycle management metrics (RCM KPIs) for US practices—from solo clinicians to multi-location groups. You’ll get simple definitions, exact formulas, step-by-step examples, practical benchmarks, dashboard layouts, CSV templates, playbooks for AR > 90, and a small-practice cheat sheet.
Primary focus: revenue cycle management metrics and revenue cycle management KPIs—turned into actionable measurement and operational playbooks.
Why KPIs Matter for Revenue Cycle Management
KPIs turn activity into measurable results. In RCM, the right KPIs reveal where cash is stuck, which payers are slow, where denials originate, and how efficient your teams are. Track them consistently to replace guesswork with decisions.
Good KPIs are:
Measurable: clear formulas
Actionable: a named owner drives follow-up
Comparable: consistent definitions over time
Repeatable: easy to automate and export
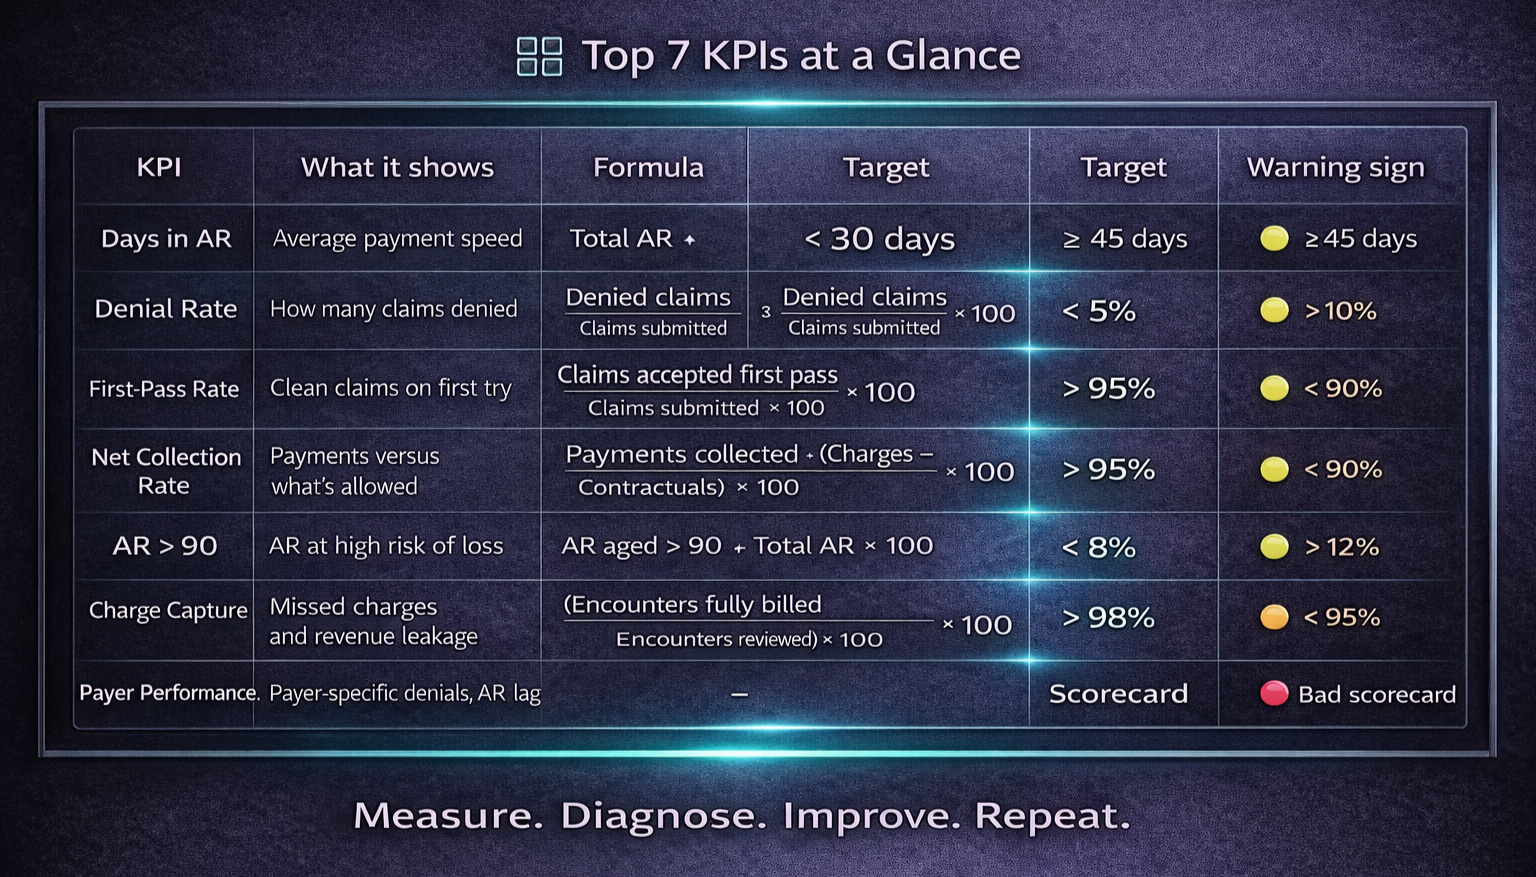
The Top 7 RCM KPIs (Overview)
Days in Accounts Receivable (Days in AR)
Denial Rate
First-Pass Acceptance Rate / Clean Claim Rate
Net Collection Rate
AR Over 90 Days (AR > 90)
Charge Capture Accuracy
Payer Performance / Payer Scorecard
Each KPI below includes meaning, formula, sample calculation, benchmark/targets, and an improvement playbook.
KPI 1 — Days in Accounts Receivable (Days in AR)
What it measures:
Average days between date of service (or claim submission) and payment. The best high-level indicator of cash-flow velocity.
Formula (common):
Days in AR = (Total AR balance ÷ Average daily charges)
Average daily charges = (Net charges for period ÷ # days in period)
Example (step-by-step):
Net charges (month) = $300,000; days = 30 → Average daily charges = 300,000 ÷ 30 = $10,000
Total AR balance = $350,000 → Days in AR = 350,000 ÷ 10,000 = 35 days
Benchmark / Target:
Aim < 30 days for many outpatient practices (specialty/payer mix may vary).
Why it matters:
High Days in AR ties up working capital, raises financing costs, and often signals payer lag or weak follow-up.
How to improve:
Prioritize work by aging buckets (0–30, 31–60, 61–90, >90)
Use payer-specific follow-up playbooks
Automate ERA posting and exception queues
Tighten eligibility checks and charge capture upstream
KPI 2 — Denial Rate
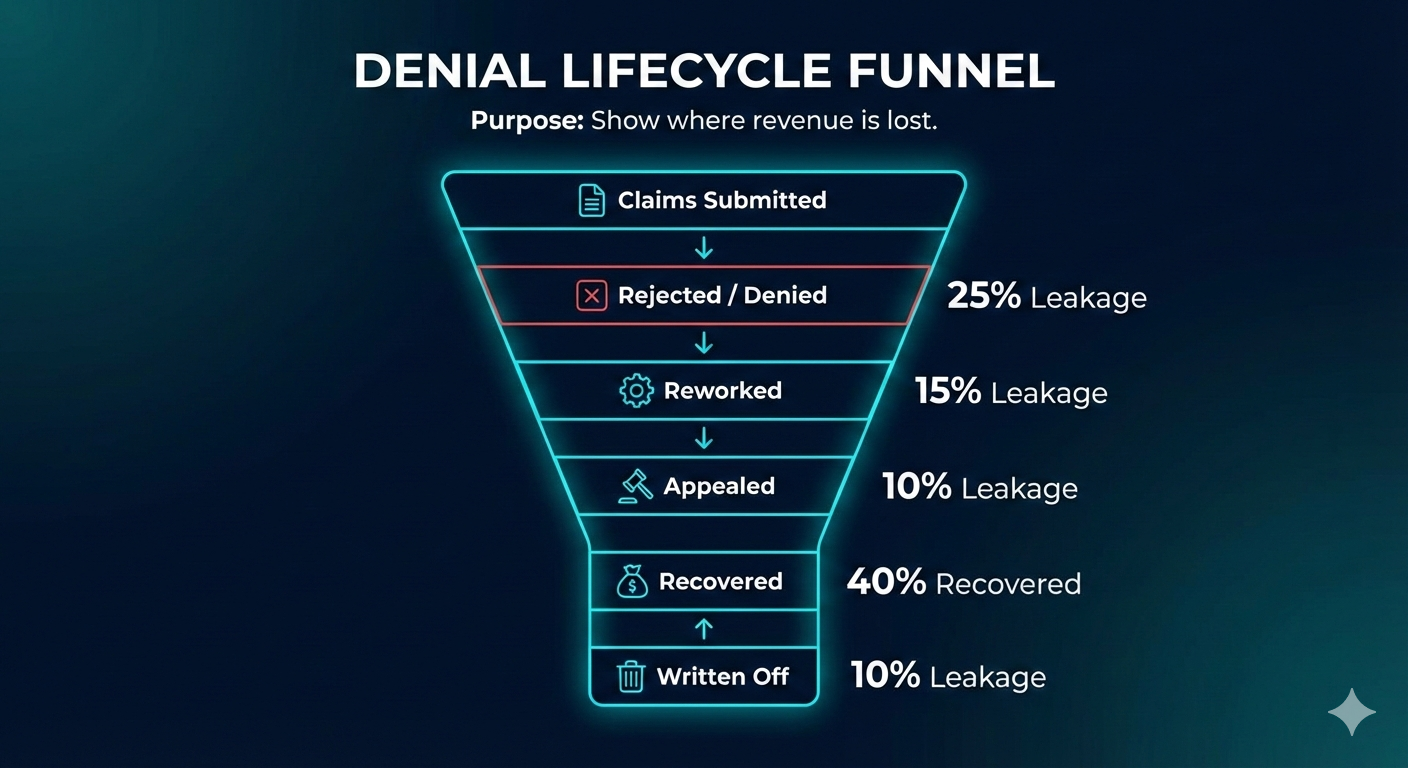
What it measures:
Percent of claims denied (initial or post-adjudication) versus claims submitted.
Formula:
Denial Rate (%) = (Denied claims ÷ Total claims submitted) × 100
Example:
Submitted = 5,000; Denied = 300 → 300 ÷ 5,000 = 0.06 → 6%
Benchmark / Target:
Typically < 5–10% (depends on specialty and payer mix).
Root causes:
Eligibility errors, missing prior auth, coding mistakes, bundling edits, timely filing.
How to improve:
Build denial root-cause analytics; fix the top 5 reasons
Strengthen eligibility and prior auth processes
Pre-bill coding QA and fast-turn appeal workflows
KPI 3 — First-Pass Acceptance Rate / Clean Claim Rate
What it measures:
Percent of claims accepted on first submission (no edits/rejections/denials).
Formula:
First-Pass Acceptance (%) = (Claims accepted first pass ÷ Total claims submitted) × 100
Example:
Submitted = 5,000; First-pass accepted = 4,500 → 4,500 ÷ 5,000 = 0.9 → 90%
Benchmark / Target:
> 90% good; > 95% best-in-class.
Why it matters:
High first-pass acceptance reduces rework, labor, and speeds reimbursement.
How to improve:
Use clearinghouse scrubbers and payer-specific edits
Standardize clinical templates for complete documentation
Continuous coder training; pre-bill audits
KPI 4 — Net Collection Rate
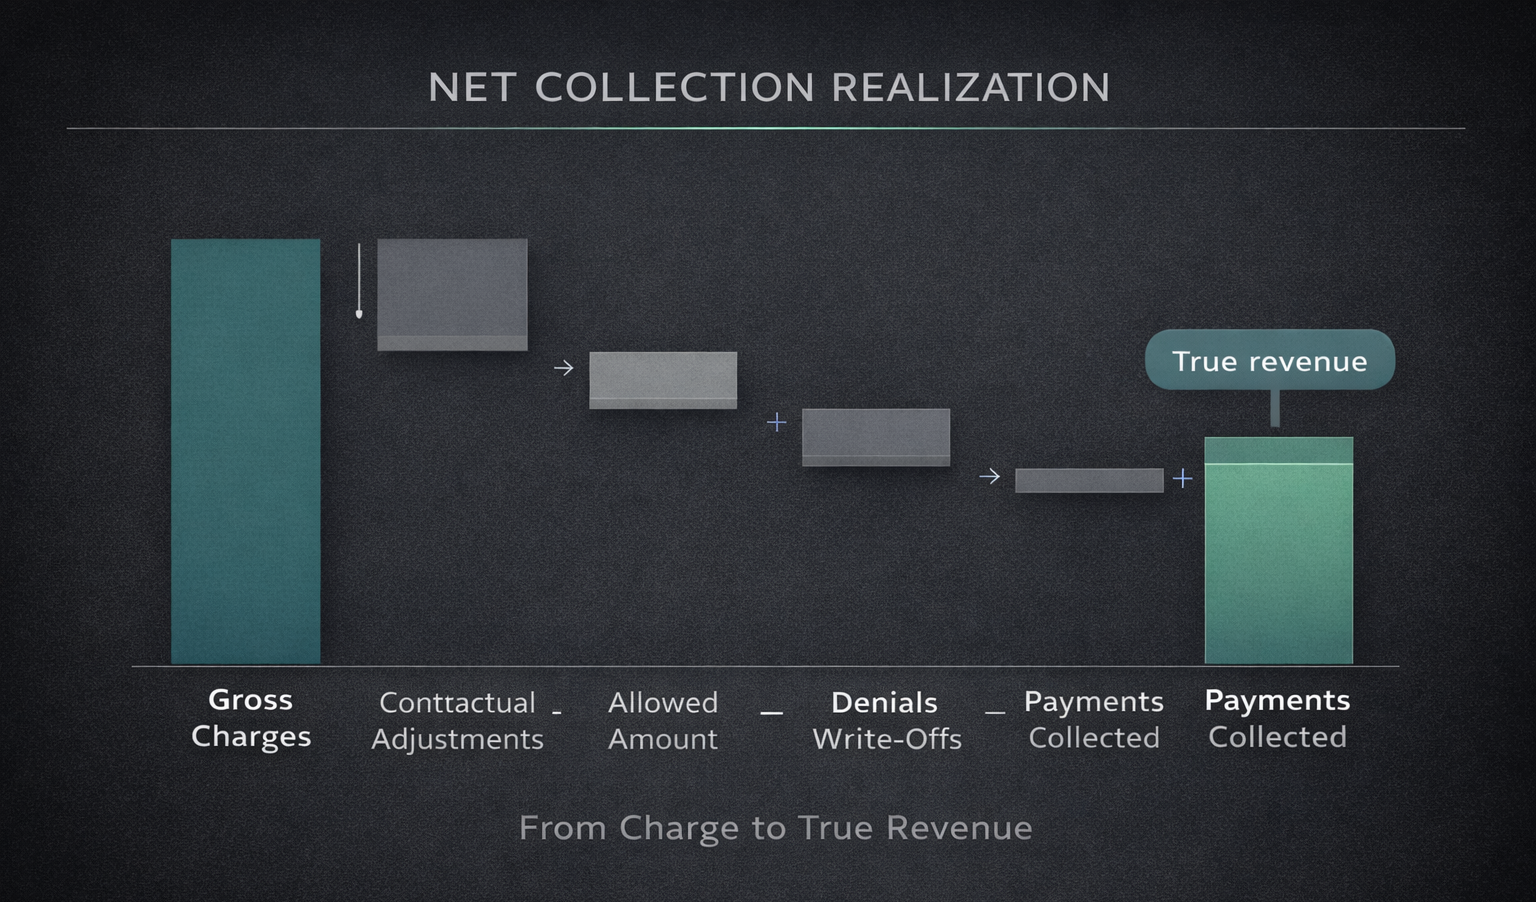
What it measures:
Percent collected versus what was allowed (charges minus contractuals).
Formula:
Net Collection Rate (%) = (Payments collected ÷ (Charges − Contractual adjustments)) × 100
Example:
Charges = 500,000; Contractuals = 150,000 → Allowed = 350,000
Payments collected = 330,000 → 330,000 ÷ 350,000 = 0.942857… → 94.3%
Benchmark / Target:
Aim > 95% where feasible; payer mix affects targets.
Why it matters:
Shows how much expected revenue actually becomes cash. Low rates point to write-offs or collection gaps.
How to improve:
Reduce denials; enforce patient collections; optimize payer contract realization
KPI 5 — AR Over 90 Days (AR > 90)
What it measures:
Percent (and dollars) of AR aged over 90 days.
Formula:
AR > 90 (%) = (AR aged > 90 ÷ Total AR) × 100
Example:
Total AR = 350,000; AR > 90 = 28,000 → 28,000 ÷ 350,000 = 0.08 → 8%
Benchmark / Target:
Healthy target < 5–8% (varies by specialty).
Why it matters:
Aged AR is strongly correlated with bad debt and cash loss.
Improvement playbook:
Escalate accounts > 60 days to specialized AR/appeals teams
Use payer-specific tactics and medical-necessity support
Tighten patient payment plans and self-pay outreach
KPI 6 — Charge Capture Accuracy
What it measures:
Percent of services documented that were billed (missed charges = invisible leakage).
How to measure (audit method):
Charge Capture Accuracy (%) = (Encounters with all services billed ÷ Encounters reviewed) × 100
Example:
Audit 200 charts; 6 had missed charges → 194 ÷ 200 = 97%
Benchmark / Target:
Aim > 98%.
Why it matters:
Small miss rates scale to large revenue loss.
How to improve:
Daily charge reconciliation reports
Point-of-care prompts and clinician templates
Routine charge audits with feedback loops
KPI 7 — Payer Performance / Payer Scorecard
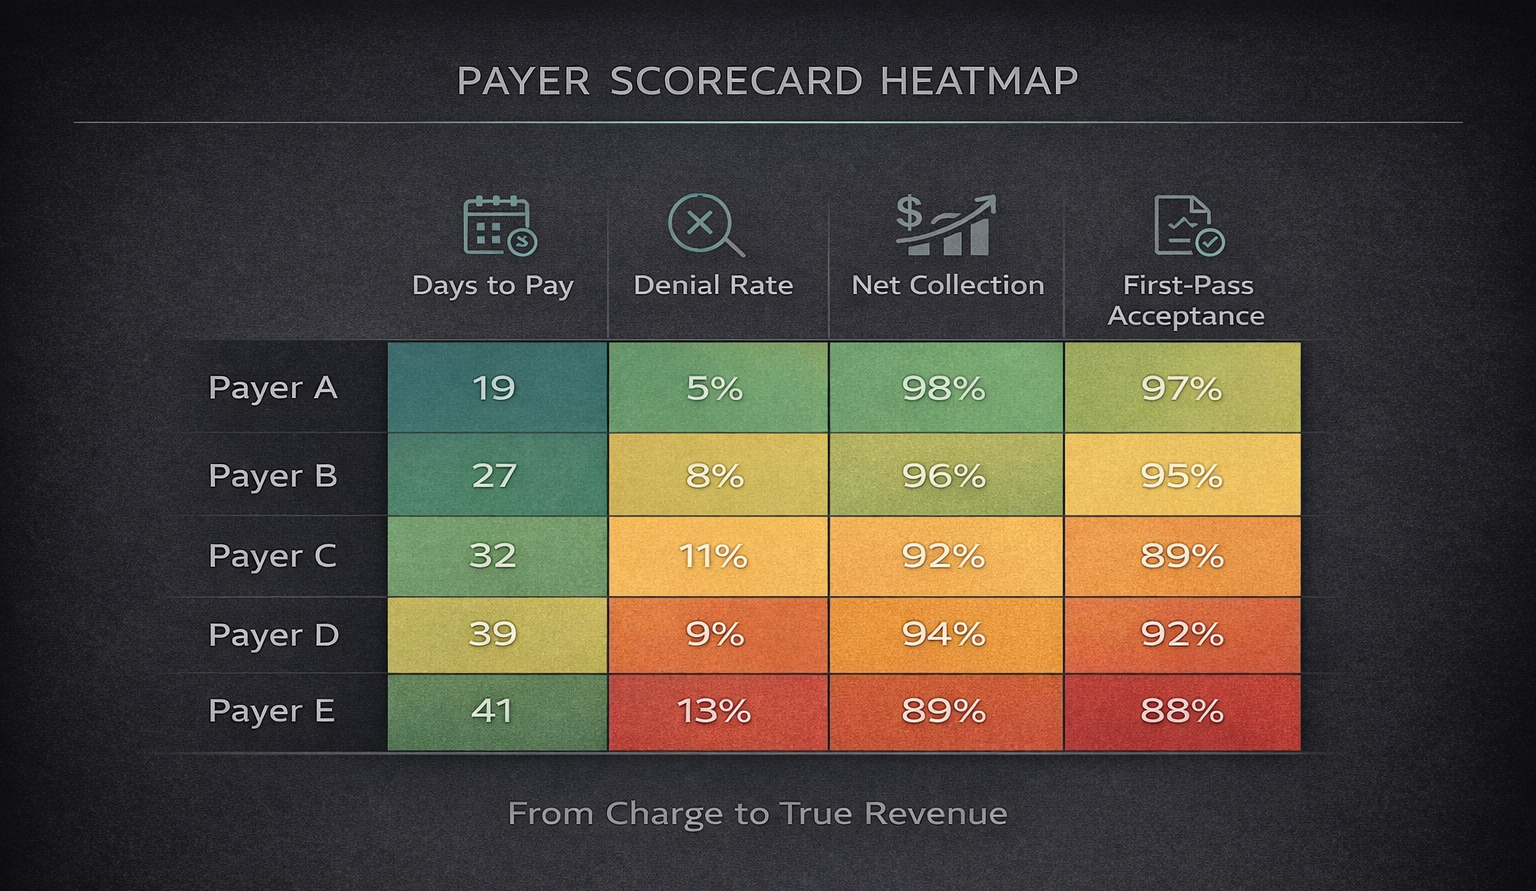
What it measures:
Multi-metric view by payer: average days to pay, denial rate, first-pass rate, net collection, AR aging.
Why it matters:
Identifies contracts to renegotiate and payers needing tailored workflows.
Example fields:
Payer, DaysToPay (e.g., 28), DenialRate (e.g., 7%), FirstPass (e.g., 92%), NetCollection (e.g., 87%), ARBalance, AROver90
How to use:
Rank payers by lag and denial dollars; attack the top problem payers first.
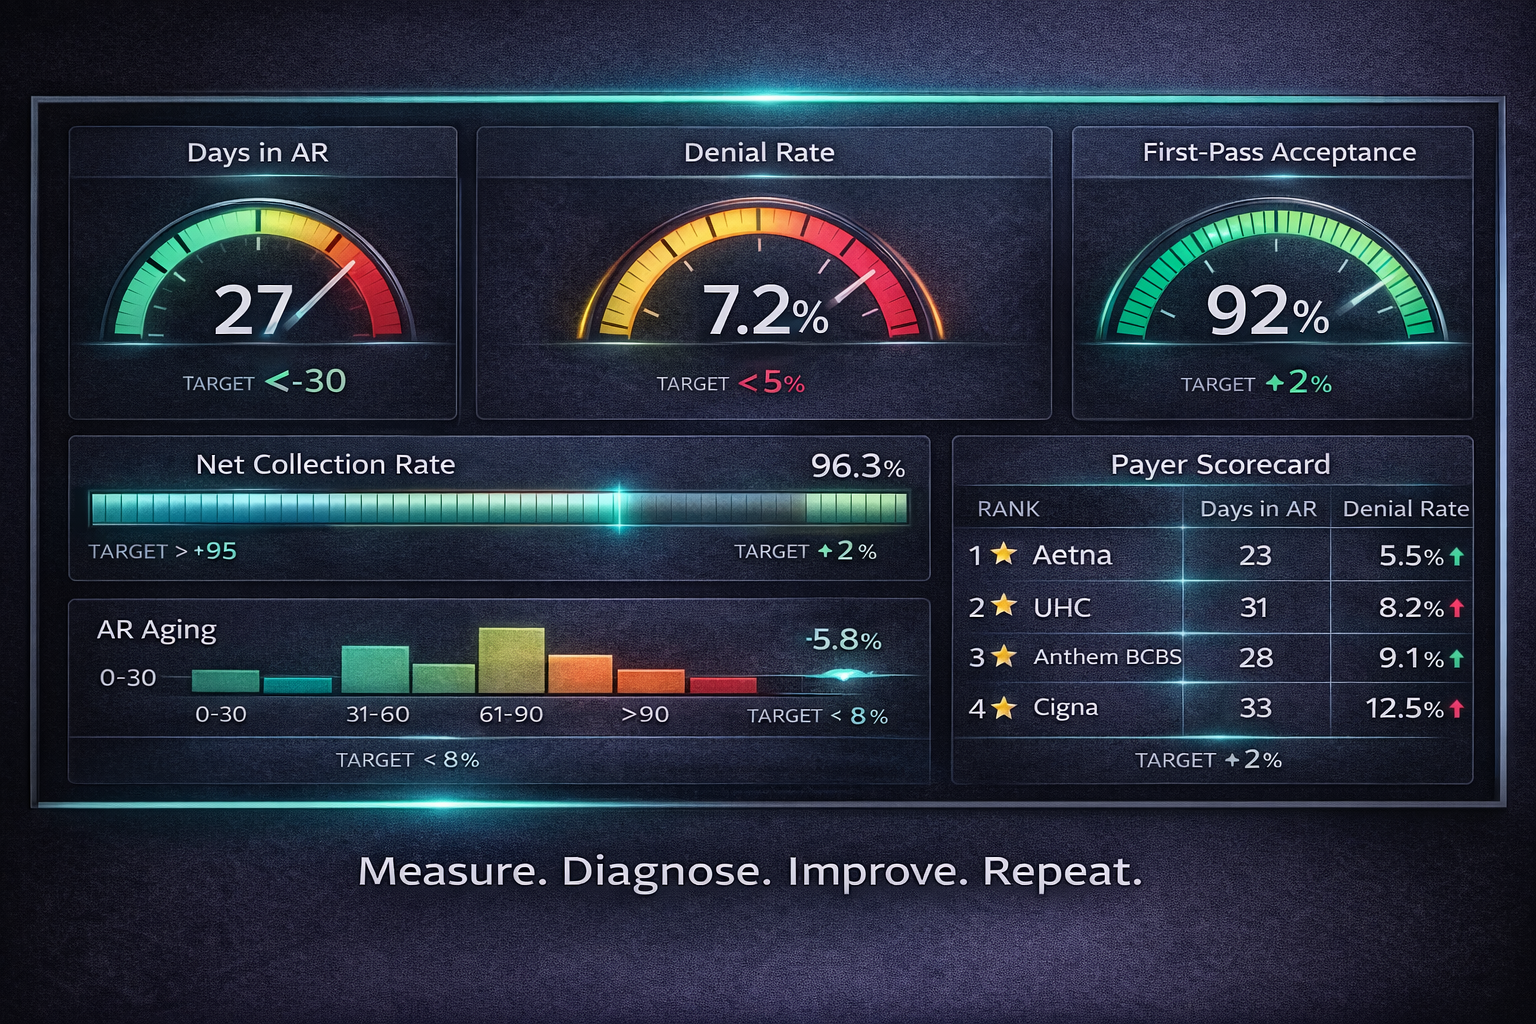
Putting KPIs Into a Real-Time RCM Dashboard
Design with 3 layers:
Executive summary (CFO-ready): Days in AR, Net Collection Rate, Denial Rate, AR > 90, monthly trendlines, cash impact; exportable 1-page PDF
Payer & Workqueue view: payer scorecards, top denial reasons, aging buckets, outstanding appeals
Operational detail: claim-level drilldowns, coder productivity, notes, owners
Visualization tips:
Time-series line for Days in AR
Heatmap for payers with longest lag
Bar chart for top denial reasons by dollars
Tables with one-click CSV/Excel export
Export features:
CSV/Excel for all tables
PDF for monthly CFO pack
Raw data API for BI tools
KPI Benchmarks & Example Targets (Practical Guide)
Days in AR: Strong < 30 | Acceptable 30–45
Denial Rate: Strong < 5% | Acceptable 5–12%
First-Pass Rate: Strong > 95% | Acceptable 90–95%
Net Collection Rate: Strong > 95% | Acceptable 90–95%
AR > 90%: Strong < 5% | Acceptable 5–10%
Charge Capture: Strong > 98% | Acceptable 95–98%
Benchmarks vary by specialty, payer mix, and region—use as starting points and track relative improvement.
Templates & Report Examples (Exportable)
1) Monthly CFO Pack — One Page
Period summary: Net collections, Charges, Adjustments
Days in AR: current vs prior month
Denial Rate: % and top 3 denial reasons with $ impact
AR > 90: dollars and percent
Action items & owners
2) Payer Scorecard (CSV fields)
PayerName, Period, DaysToPay, DenialRatePct, FirstPassPct, NetCollectionPct, ARBalance, AROver90
3) Workqueue Export (CSV fields)
ClaimID, DOS, Payer, BilledAmount, Status, DaysOutstanding, CurrentOwner
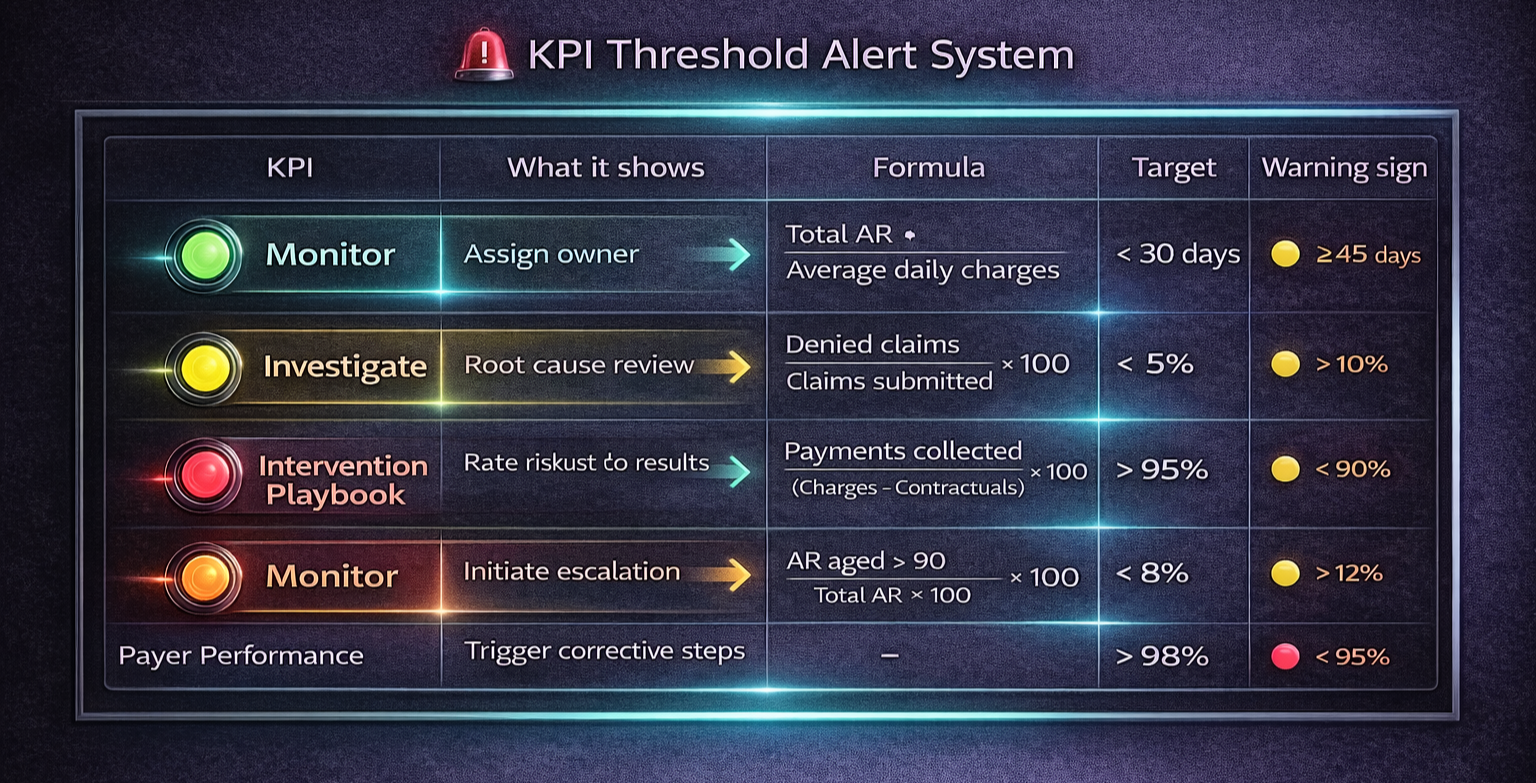
Playbook: What to Do When KPIs Cross Thresholds
Scenario A — Days in AR > 35 (rising):
Run aging report; isolate top 20 highest-dollar AR > 30 days
Assign specialized follow-up; verify denials in the same window
Fix systemic issues (eligibility, coding, prior auth)
Scenario B — Denial Rate > 8%:
Drill into top 5 denial reasons by dollars
Map each reason to an upstream owner; add scrubber rules or staff training
Track weekly until back under target
Scenario C — AR > 90 > 8%:
Escalate to appeals team; add provider notes/medical necessity
Renegotiate payer processes if systemic; consider external collections for long self-pay
Implementation Roadmap (30 / 60 / 90 Days)
0–30 days
Standardize KPI definitions
Automate data pulls from PM/EHR/clearinghouse
Build a basic dashboard (Days in AR, Denial Rate, First-Pass)
30–60 days
Add payer scorecards, workqueue exports, alerting for thresholds
Start weekly KPI reviews with named owners
60–90 days
Automate CFO PDF exports; align KPI targets with SLAs
Launch denial root-cause projects with specific reduction goals
Special Considerations for Small Practices
Start with a focused KPI set: Days in AR, Denial Rate, First-Pass Acceptance, Patient collections %.
Use weekly snapshots and a monthly one-pager. Consider outsourcing coding, appeals, or patient collections to move the needle quickly.
Common Pitfalls & How to Avoid Them
Inconsistent definitions: lock the Days in AR formula and publish it
Poor data hygiene: normalize payer names and claim IDs
No ownership: assign KPI owners and due dates
Overreporting: trim non-actionable metrics
Governance & Communication
Weekly ops huddle: review thresholds and assign tasks
Monthly executive summary: CFO pack with one-page insights and decisions
Quarterly strategy: align KPIs with goals, budgets, and contract negotiations
Measuring ROI From KPI Improvements (Quick Example)
Reduce Days in AR from 40 → 30 with monthly net collections of $300,000.
The faster cash velocity releases working capital and lowers financing needs.
For precise ROI, use your AR aging, interest rates, and working-capital assumptions in finance’s model.
Final Checklist: Getting KPIs Right
Define clear formulas and keep them consistent
Automate data ingestion and exports
Build dashboards with executive + operational layers
Assign owners and SLA targets
Run weekly and monthly reviews with documented actions
FAQs — Revenue Cycle Management KPIs
Q1: Which KPI first?
Start with Days in AR and Denial Rate—they expose cash delays and process errors.
Q2: Reporting cadence?
Ops KPIs weekly; CFO pack monthly; real-time alerts for critical thresholds (e.g., AR > 90 spikes).
Q3: Data sources?
Practice Management (charges/claims), EHR (clinical context), Clearinghouse (statuses), ERA files (payments).
Q4: Are benchmarks reliable?
Directional only—specialty and payer mix matter. Track trend improvement.
Q5: Cost to build a dashboard?
Ranges widely—from built-in PM exports to enterprise BI. Weigh costs against denial reduction and faster cash.
Q6: Can small practices use the same KPIs?
Yes—use a compact set and weekly cadence; targets can be right-sized.