
The 2026 Denial Management Playbook — Cut Claim Denials to Under 6% in 90 Days

Denials aren’t inevitable—they’re manageable. This playbook shows how to classify, measure, and eliminate the top denial causes so your practice can drop overall Denial Rate to <6% in 90 days, improve cash velocity, and reduce rework. You’ll get a step-by-step plan, exact formulas, sample appeal scripts, RCA templates, dashboard layouts, and a weekly governance cadence you can run tomorrow.
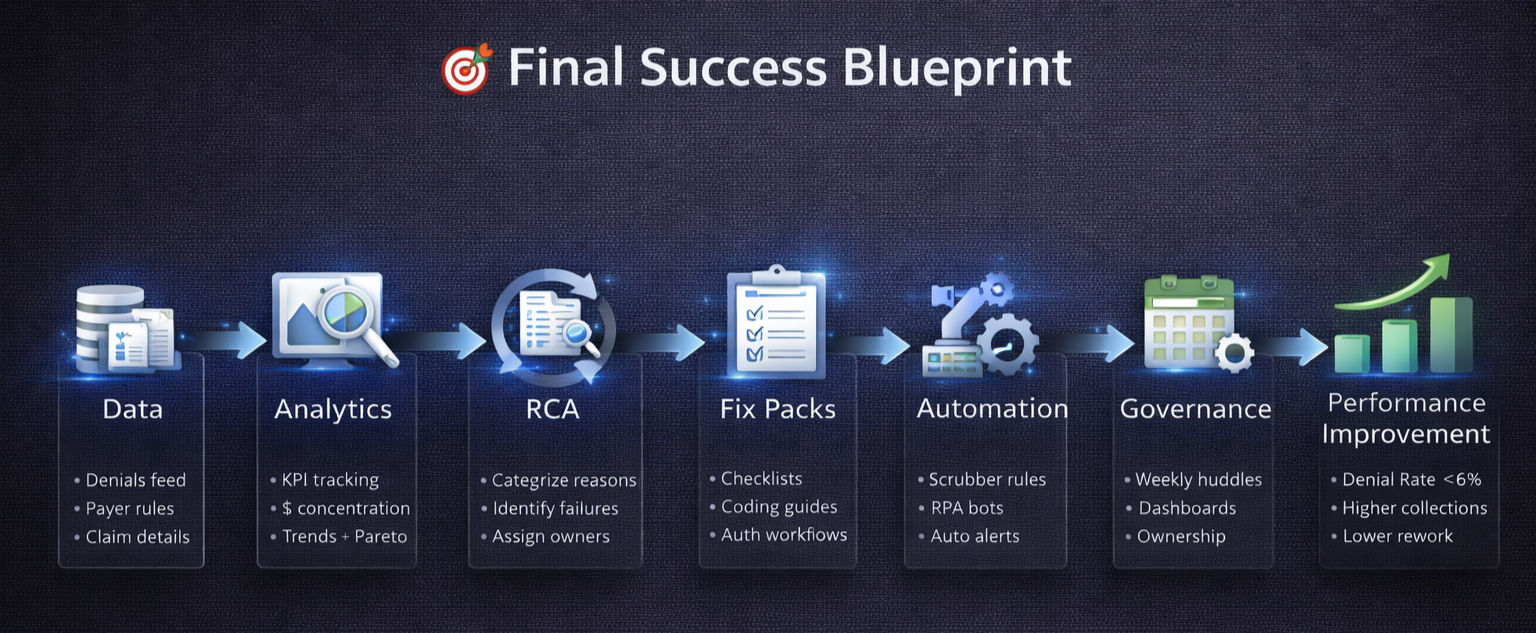
Primary focus: denial management, denial root-cause analysis (RCA), appeals workflows, and automation—turned into an actionable 90-day program.
Why Denial Management Matters More in 2026
Payer edits and pre-auth rules are tighter than ever.
Staffing constraints magnify the cost of rework.
Clean claims and fast appeals have an outsized ROI on cash flow and working capital.
Denials drain productivity across registration, coding, billing, and collections. Fixing a small set of root causes consistently beats “working harder” on every single denial.
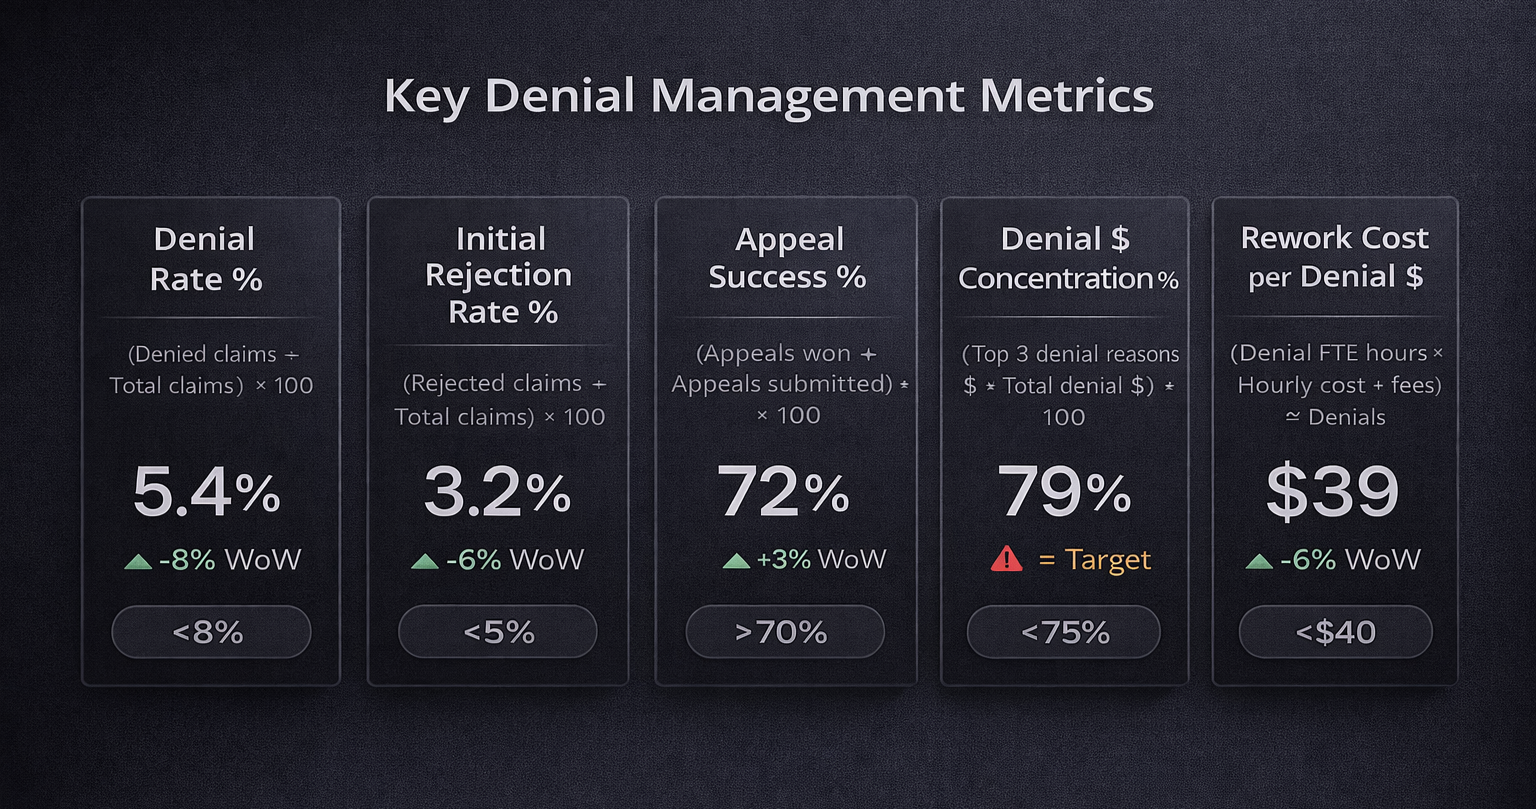
The Denial Metrics That Matter (with Formulas)
1) Denial Rate (%)
= (Denied claims ÷ Total claims submitted) × 100
Example: 250 denied out of 4,000 submitted → 250 ÷ 4,000 = 0.0625 → 6.25%
2) Initial Rejection Rate (%) (clearinghouse/payer edits)
= (Rejected claims on first pass ÷ Total claims submitted) × 100
3) Appeal Success Rate (%)
= (Appeals won ÷ Appeals submitted) × 100
4) Denial $ Concentration (%)
= (Top 3 denial reasons $ ÷ Total denial $) × 100
Goal: Concentrate fixes where most dollars are stuck.
5) Rework Cost per Denial ($)
= (Denial FTE hours × Hourly cost + fees) ÷ Denials worked
Track all five weekly. Publish trends and owners.
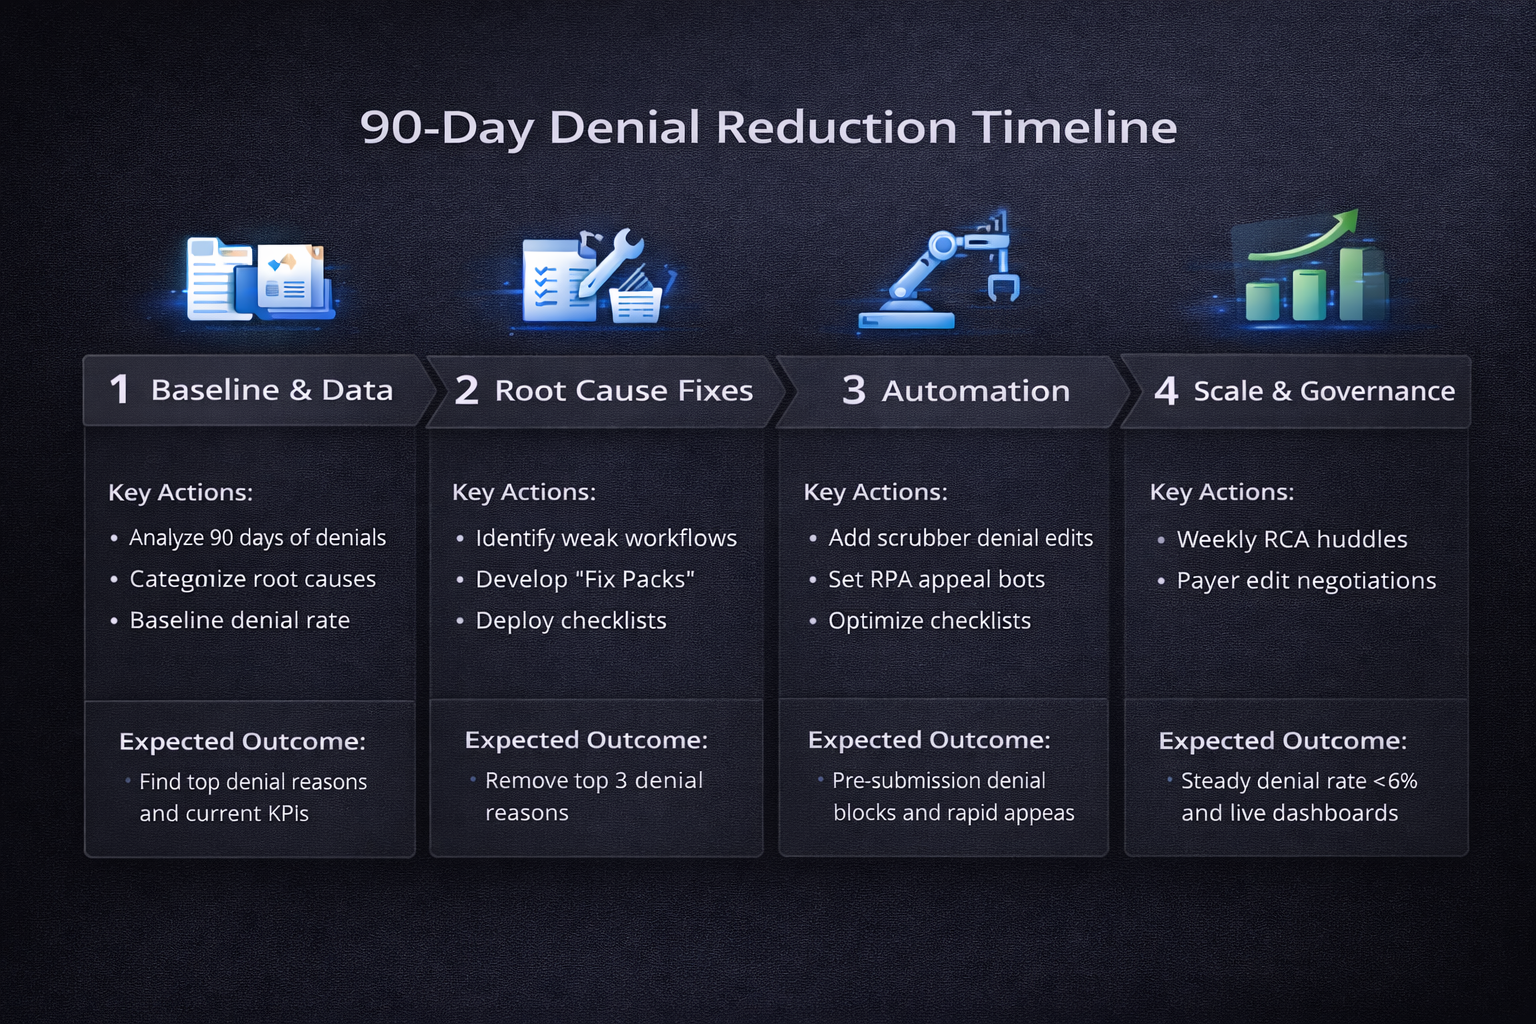
The 90-Day Denial Reduction Plan (Week-by-Week)
Weeks 1–2: Baseline & Build the View
Pull 90 days of denials with fields:
ClaimID, DOS, Payer, AmountBilled, DenialReason, CARC/RARC, DaysToDenial, Owner, Status.Normalize payer names; map CARC/RARC to friendly “Denial Reason Categories” (Eligibility, Prior Auth, Coding, Bundling/Modifier, Timely Filing, Medical Necessity, Demographics, Other).
Create a Pareto chart of denial dollars by reason.
Publish current metrics (Denial Rate, Appeal Success, Top 5 reasons by $).
Weeks 3–4: Root-Cause Workshops & Fix Packs
Run 60-minute workshops for each top reason with the process owners (registration, coding, clinical, billing).
For each reason, complete a one-page RCA card:
Definition, upstream point of failure, SOP gap, data example, fix, owner, due date.
Ship “Fix Packs”: eligibility scripting, authorization checklists, coding tip-sheets, order templates, modifier guides, scrubber rules.
Weeks 5–8: Automate & Standardize
Add pre-submission edits in the scrubber for top failure patterns (e.g., missing PA, invalid modifier pairs).
Deploy checklists at registration (ID, insurance, coordination of benefits, COB notes).
Introduce CDI prompts inside note templates for common medical-necessity pitfalls.
Turn on RPA bots for claim status checks and standard appeal packet assembly.
Weeks 9–12: Lock in Gains & Scale
Weekly Denial Huddle (30 minutes) to review trendlines and “fix adoption” rates.
Start payer-specific appeals playbooks and renegotiate edits if issues are systemic.
Publish before/after dashboards and roll improvements to all locations/providers.
Denial RCA Categories & “Fix Packs”
CategoryTypical Root CausesFix Pack HighlightsEligibilityOutdated plan, inactive coverage, wrong member IDReal-time eligibility (270/271), ID scan & OCR, COB script, re-verify at check-inPrior AuthorizationMissing/expired auth, wrong CPT or site of servicePre-auth checklist by service, auth tracker, scrubber block if PA flag = falseCodingIncorrect ICD-10/CPT, missing linkage, specificity issuesCoder QA, diagnosis-procedure linkage rules, specialty tip-sheetsBundling/ModifierWrong or missing modifiers, NCCI editsModifier matrix by payer, NCCI pre-edits, provider education cheat-sheetsTimely FilingLate submission, unclear clock startTFL matrix by payer, clock alerts at day 15/25/45, workqueue escalationsMedical NecessityInsufficient documentation, LCD/NCD mismatchOrder templates with indications, CDI prompts, payer policy libraryDemographicsName/DOB mismatch, address errorsID validation at intake, upfront demographics auditOtherCoordination issues, experimental codes, coverage limitsPolicy library, exception review, payer liaison escalation
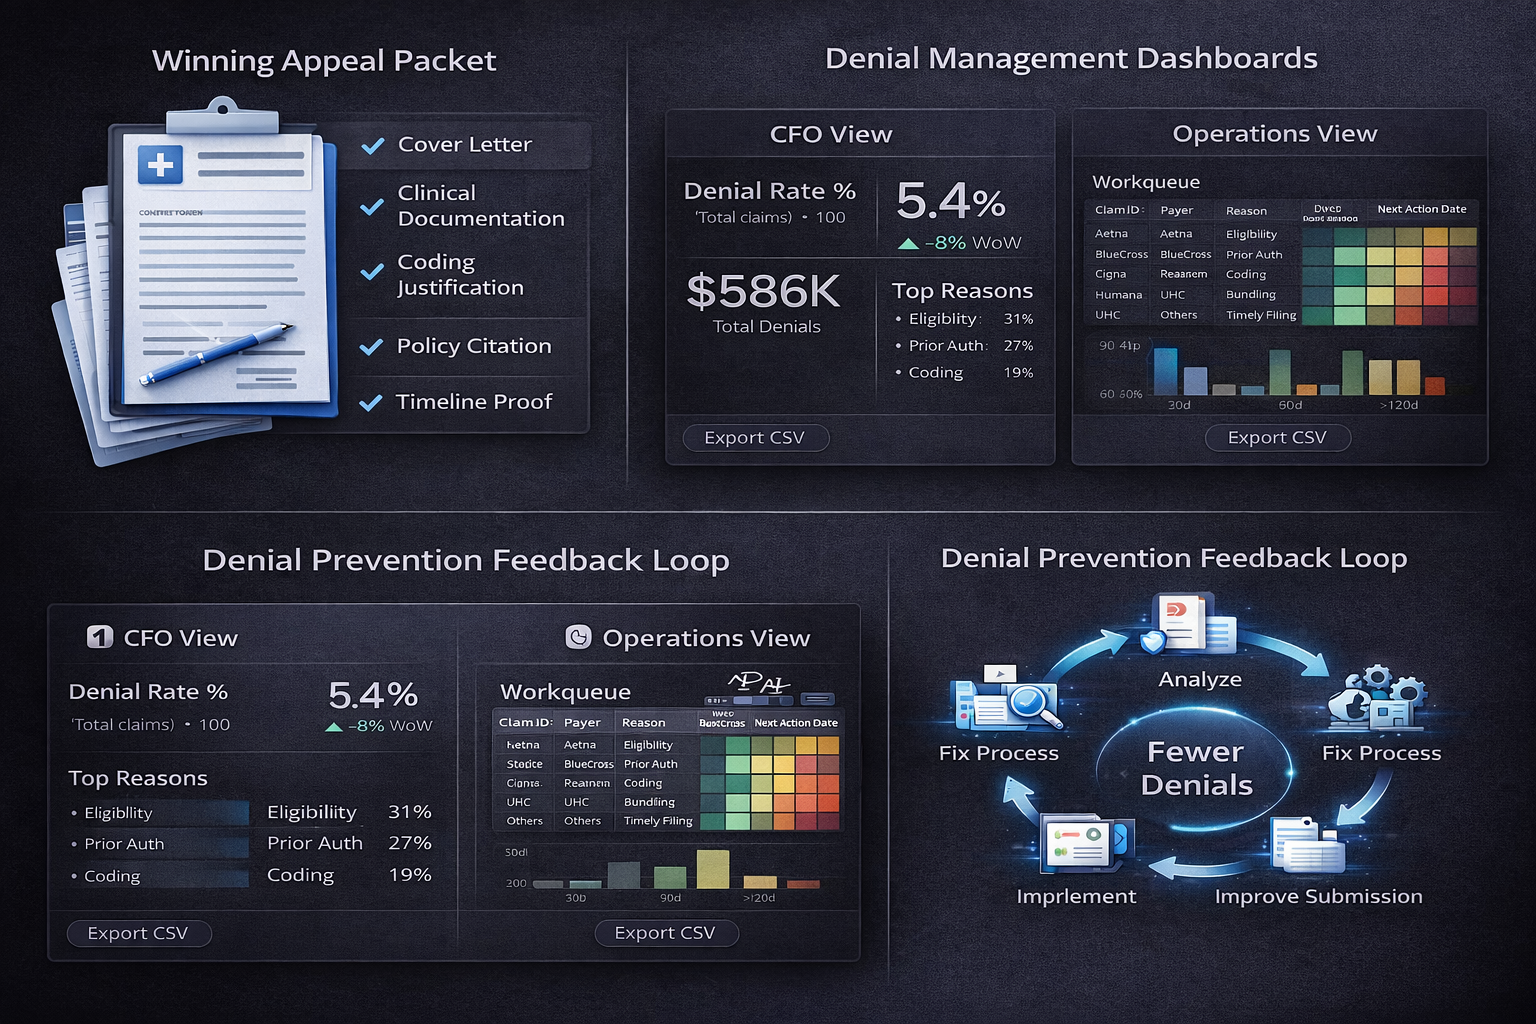
Appeals That Win (Templates & Tactics)
Appeal Packet Checklist (standard):
Payer form + cover letter
Clinical documentation (H&P, progress notes, imaging/lab, operative notes)
Coding references (ICD-10/CPT rationale)
Policy citation (LCD/NCD, payer manual page)
Timeline proof (submission, status, contact logs)
Sample Cover Letter (outline):
Opening: Claim/Patient identifiers, DOS, denial reason code
Medical Necessity: One paragraph linking findings to policy criteria
Coding Justification: One paragraph with code linkage and authoritative references
Attached Evidence: List documents; highlight key pages
Close: Requested action (reprocess & pay), contact, turnaround expectation
Turnaround Targets:
Submit first-level appeal within 10 business days of denial receipt.
Escalate to second level by Day 20 if no resolution.
The Denial Dashboard: Design & Exports
Executive Board (CFO-ready)
Denial Rate %, Appeal Success %, Denial $ (MTD), Top 5 reasons by $, Days to Denial trend.
Export: 1-page PDF.
Operational View
Tables:
Denials by Payer & Reason (dollars and count)
Workqueue:
ClaimID, DOS, Payer, Reason, DaysOutstanding, Owner, NextActionDate
Charts:
Pareto of Denial $ by Reason
Heatmap of Payer × Reason
Line: Appeal Success % (weekly)
CSV Schemas (copy/paste):
RCA Export
ReasonCategory, CARC, RARC, DollarImpact, Volume, Owner, SOPFix, GoLiveDate
Appeals Log
ClaimID, Payer, DenialReason, AppealLevel, SubmittedDate, DecisionDate, Outcome, DollarsRecovered, Notes
Small Practice Fast-Track (Minimalist Stack)
Weekly Two-Metric Focus: Denial Rate %, Top Denial Reason $.
One Fix at a Time: Ship one checklist or scrubber rule per week.
Use Templates: Reuse appeal letters; maintain a simple RCA spreadsheet.
Outsource Wisely: If bandwidth is tight, outsource appeals on high-dollar claims only.
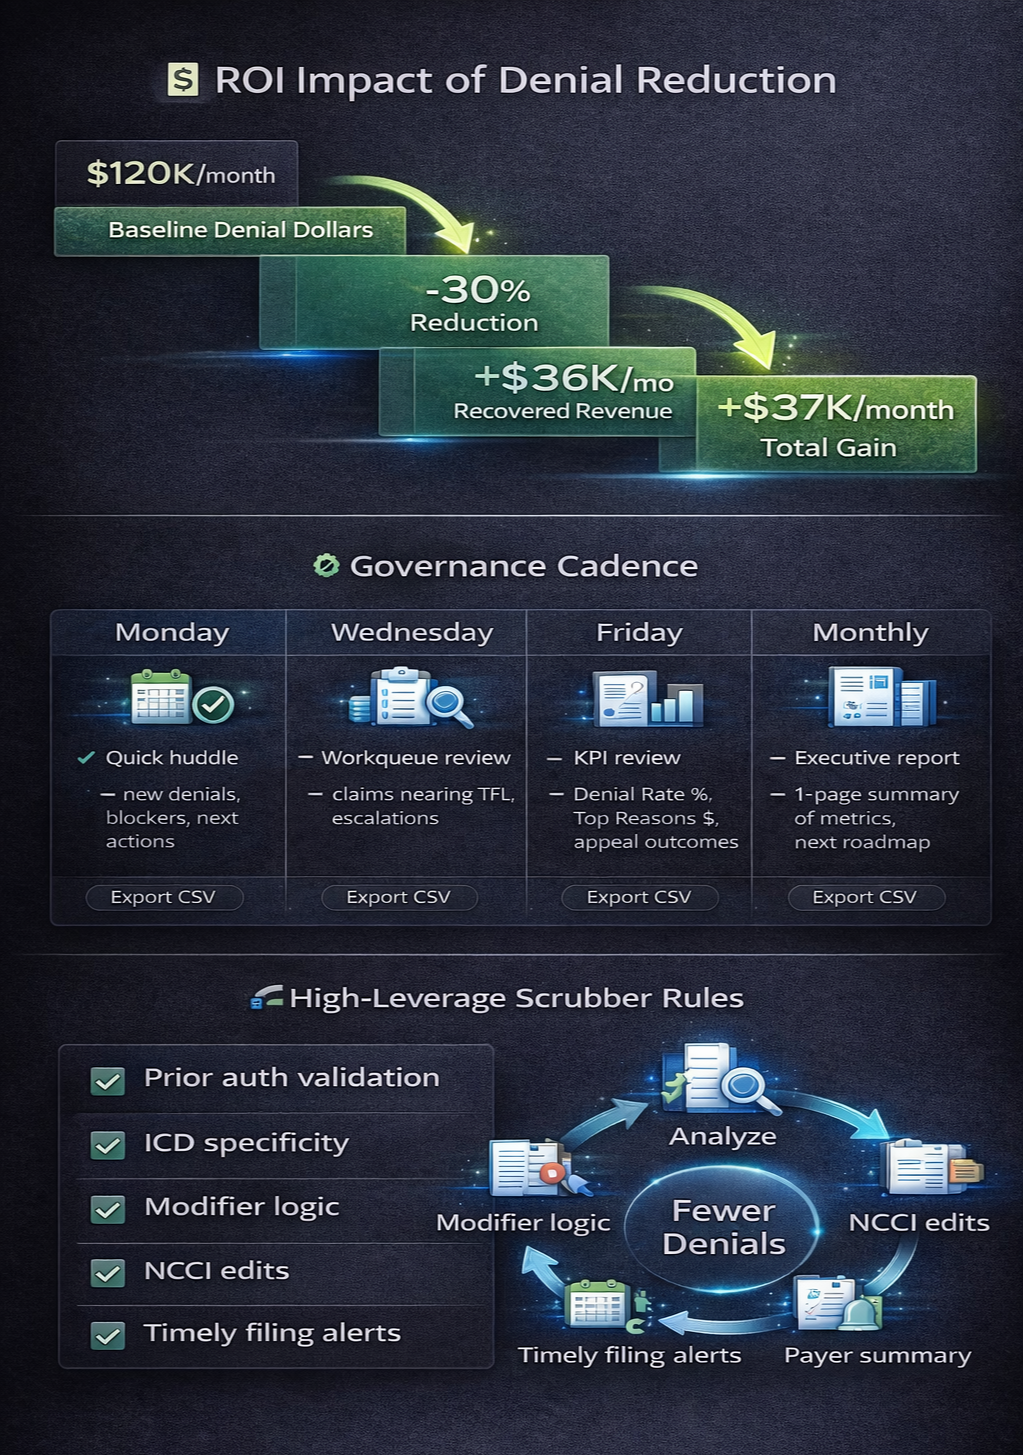
Example ROI (Worked, Step-by-Step)
Monthly denied dollars (baseline): $120,000
Target reduction after 90 days: 30%
Expected dollars recovered: 120,000 × 30% = $36,000 per month
Denial FTE cost reduction (estimate): 40 hours/week → 30 hours/week (−10)
Hourly cost: $30 → Weekly save: 10 × $30 = $300 → Monthly ≈ $1,300
Total monthly benefit ≈ $36,000 + $1,300 = $37,300
(Arithmetic checks: 120,000 × 0.30 = 36,000 exactly; FTE calc approximated at 4.33 weeks/month → 300 × 4.33 ≈ 1,299 → $1,300.)
Governance Cadence (Keep It Moving)
Mon: 15-min huddle—new denials, blockers, next actions
Wed: Workqueue sweep—claims approaching TFL, escalations
Fri: 30-min review—Denial Rate %, Top 3 reasons $, appeal outcomes, shipped fixes
Month-End: CFO one-pager + next month’s fix roadmap
10 High-Leverage Scrubber Rules (Copy This List)
Block claim if PA flag = false for PA-required CPTs
ICD-10 specificity check (laterality/severity where required)
Modifier pairs validation (e.g., 25/59/XS/XP per payer policy)
Site-of-service vs CPT mismatch
Demographic completeness (DOB, legal name per ID, subscriber ID format)
NCCI bundling edits pre-check
TFL countdown alerts at D15/D25/D45 (payer-specific)
COB indicator if multiple plans detected
Medical necessity keyword prompts for high-risk services
Missing/invalid referring provider NPI for services that require it
Denial Playbooks by Payer (What to Track)
Median Days-to-Pay after Appeal
Top CARC codes by $
Appeal acceptance reasons (what language works)
Policy links & update cadence (bookmark landing pages)
Liaison contacts and escalation routes
Common Pitfalls (And How to Dodge Them)
Inconsistent Categories: Publish a single denial taxonomy and lock it.
Solo Ownership: Assign a named owner per reason; rotate deputies.
No Feedback to Clinicians: Close the loop with 5-minute “tips” in provider meetings.
Delayed Appeals: SLA your first-level appeal—10 business days.
No Measurement: A weekly 1-pager beats a monthly data dump.
Tools & Integrations (Practical Picks)
Practice Management/EHR: Athenahealth, NextGen, eCW, Kareo
Clearinghouse: Availity, Change Healthcare, Office Ally
Analytics: Power BI / Tableau (exports + role-based access)
Automation: UiPath / Automation Anywhere (status checks, packet assembly)
Collaboration: Teams/Slack + shared appeal templates & SOPs
(Choose lightweight first; add complexity only when you’re hitting targets.)
Templates (Quick Start)
RCA One-Pager (fill-in):
Reason Category: ______
Payer(s): ______
$ Impact (last 30/60/90): ______
CARC/RARC: ______
Upstream Gap: ______
Fix Pack: ______
Owner: ______ Due: ______
Success Metric: (e.g., Reason share % from 22% → 12%)
Provider Tip-Sheet (example):
When ordering [service], include: indication, prior failed therapy, duration, key findings.
If [modifier] used, document distinct service element in note section X.
FAQs — Denial Management (Beginner to Advanced)
Q1: What’s a good Denial Rate target?
Under 6–8% for many outpatient specialties; push lower with strong scrubber rules.
Q2: What wins more appeals—letters or policy citations?
Both. Strong letters referencing payer policy/LCD/NCD plus precise clinical excerpts win most.
Q3: How soon should I appeal?
Submit within 10 business days; log submissions and outcomes weekly.
Q4: Is automation worth it for small practices?
Yes—start with status checks and appeal packet assembly. Low lift, strong ROI.
Q5: How do I pick what to fix first?
Follow Pareto: Fix the top 3 denial reasons by dollars, not by count.
Final Checklist — Hit <6% Denials in 90 Days
Define Denial Rate, Appeal Success, Top 5 Reasons by $
Publish one denial taxonomy and owners
Ship one Fix Pack/week (eligibility, PA, coding, etc.)
Implement 10 scrubber rules (start with PA/modifier/TFL)
Run the Mon/Wed/Fri cadence + monthly CFO one-pager
Track before/after ROI and keep only what works